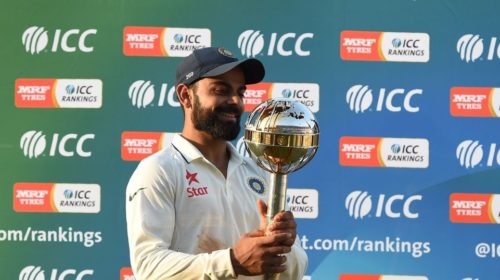
Latest TEST RANKING 2018
|
Pos |
Team |
Matches |
Points |
Rating |
|
1 |
India |
29 |
3,634 |
125 |
|
2 |
South Africa |
32 |
3,589 |
112 |
|
3 |
Australia |
33 |
3,499 |
106 |
|
4 |
New Zealand |
23 |
2,354 |
102 |
|
5 |
England |
39 |
3,772 |
97 |
|
6 |
Sri Lanka |
35 |
3,182 |
91 |
|
7 |
Pakistan |
21 |
1,853 |
88 |
|
8 |
Bangladesh |
16 |
1,202 |
75 |
|
9 |
West Indies |
26 |
1,860 |
72 |
|
10 |
Zimbabwe |
8 |
12 |
2 |
Men’s ODI Team Rankings
|
Pos |
Team |
Matches |
Points |
Rating |
|
1 |
England |
48 |
6,053 |
126 |
|
2 |
India |
45 |
5,492 |
122 |
|
3 |
South Africa |
34 |
3,842 |
113 |
|
4 |
New Zealand |
41 |
4,602 |
112 |
|
5 |
Pakistan |
32 |
3,279 |
102 |
|
6 |
Australia |
37 |
3,699 |
100 |
|
7 |
Bangladesh |
24 |
2,220 |
93 |
|
8 |
Sri Lanka |
43 |
3,302 |
77 |
|
9 |
West Indies |
29 |
1,989 |
69 |
|
10 |
Afghanistan |
28 |
1,758 |
63 |
|
11 |
Zimbabwe |
37 |
2,021 |
55 |
|
12 |
Ireland |
20 |
766 |
38 |
|
13 |
Scotland |
16 |
535 |
33 |
|
14 |
UAE |
13 |
236 |
|
Men’s T20I Team Rankings
|
Pos |
Team |
Matches |
Points |
Rating |
|
1 |
Pakistan |
28 |
3,622 |
129 |
|
2 |
Australia |
18 |
2,276 |
126 |
|
3 |
India |
35 |
4,366 |
125 |
|
4 |
England |
19 |
2,200 |
116 |
|
5 |
New Zealand |
22 |
2,542 |
116 |
|
6 |
South Africa |
18 |
2,058 |
114 |
|
7 |
West Indies |
18 |
2,048 |
114 |
|
8 |
Afghanistan |
25 |
2,287 |
91 |
|
9 |
Sri Lanka |
27 |
2,287 |
85 |
|
10 |
Bangladesh |
24 |
1,686 |
70 |
|
11 |
Scotland |
15 |
927 |
62 |
|
12 |
Zimbabwe |
17 |
960 |
56 |
|
13 |
UAE |
12 |
608 |
51 |
|
14 |
Netherlands |
12 |
598 |
50 |
|
15 |
Hong Kong |
10 |
420 |
42 |
|
16 |
Oman |
7 |
270 |
39 |
|
17 |
Ireland |
17 |
589 |
35 |
Women’s Team Rankings (Overall)
|
Pos |
Team |
Matches |
Points |
Rating |
|
1 |
Australia |
55 |
7,284 |
132 |
|
2 |
England |
57 |
7,172 |
126 |
|
3 |
New Zealand |
66 |
7,937 |
120 |
|
4 |
India |
66 |
7,396 |
112 |
|
5 |
West Indies |
48 |
4,725 |
98 |
|
6 |
South Africa |
76 |
7,248 |
95 |
|
7 |
Pakistan |
55 |
4,081 |
74 |
|
8 |
Sri Lanka |
55 |
3,416 |
62 |
|
9 |
Bangladesh |
34 |
1,428 |
42 |
|
10 |
Ireland |
24 |
659 |
27 |

